…we’re probably doing some really stupid things in CSS we don’t know about…
This is a sentence from around 2009 said by Douglas Crockford and, despite the context where it was said, I would like to use it as a starting point for this article.
A few years ago, browsers were just something used to display text, tables, forms, images and occasionally some more complex graphics in the form of animated GIFs.

We didn’t have to know anything about how browsers render stuff. Above all, our time and sweat was spent ensuring that CSS and HTML (and occasionally javascript) was working across multiple browsers (IE5 and others).
We were used to learning CSS, JS and HTML and worry mostly about compliance rather than performance. This led us to do things in a certain way without actually knowing why or even if they were correct. We did it simply because it worked.
We didn’t have the tools to learn this kind of stuff and even more importantly, we didn’t have the need to learn this kind of stuff. But everything starts changing when 3 main things start happening: modern browsers, mobile and modern web.
Modern browsers gave us the ability to inspect our code and understand exactly what we have been doing until that point. They showed us that by using that insignificant CSS attribute or that single line of Javascript, our page was taking 15 seconds longer to load and the CPU was running at maximum speed.
Mobile, by its side, pushed us to be more careful with the amount of stuff that we were loading on screen and with that, forced us to do our code differently by taking into account the slow speeds of the first mobile phones.
Finally, the modern web was responsible for the incredible and sometimes crazy stuff that we are “forced” to implement nowadays and impelled us to the point that, if we just technically know a way of doing something without actually understanding why, probably the result is going to be a lousy animation or a lousy interaction.
So the goal with this article is to show solutions and demonstrate that, by making some inoffensive mistakes, we can create so much damage to a web application to the point where because it takes so much time to load, some potential customers could go away and do their shopping elsewhere.
How a Browser Renders a Page
Before Jumping into the main topic of this article, first we need to understand how the browser renders a page.
Let’s sum up the steps:
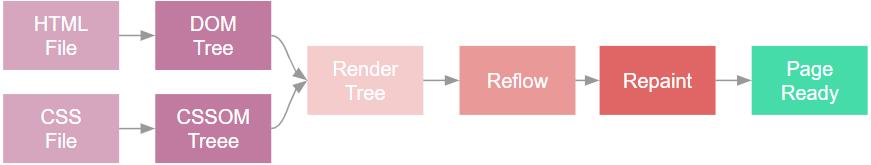
1. As soon as the user enters the URL, the browser fetches the HTML source code from the server and then parses that HTML and convert it into the tokens we all know and love, like,,
- The RenderTree is constructed following the next steps:
I – It starts from the root of the dom tree and compute which element is visible and it’s computed styles;
II – It ignores the not visible elements like (meta, script, link) and the ones with “display: none;”;
III – Matches each visible node to the appropriate CSSOM rules and applies them;4. Only after all these steps are done the browser starts to bother with how to display (Reflow) and style (Repainting) things on screen;
Reflow
By definition, “Reflow” is the process the web browser uses to re-calculate the positions and geometries of elements in the document. It’s basically the effort the browser needs to do to position every element in the screen every time something changes (either by a refresh, a screen resize or a common show/hide content action).The Reflow happens when the changes made to the elements affects the layout of a portion of the page or the whole page. The Reflow of an element will cause the subsequent reflow of all the child and ancestor elements in the DOM.Also important to know is that a reflow operation is a user blocking operation, which means the user cannot interact with the page until reflow is finished.
Repaint
“Repaint” is the definition given to the process where the browser starts giving the right appearance to the elements that were placed in the Rendered Tree such as background colors or font-sizes.
Repainting also happens in situations such as showing an hidden element, animating a node or changing a text color.
What may cause Reflow and Repaint
Bellow we can see in detail some more common tasks that may affect reflow, repaint or both:
Change CSS properties like padding/margin/border: Reflow and Repaint;
Changing colours like a background or border colour: Repaint;
Changing a font-size: Reflow and Repaint;
Append/remove an element to DOM: Reflow and Repaint;
Hiding DOM elements with “display: none;”: Reflow and Repaint;
Hiding DOM Element with “visibility: hidden;”: Repaint;
Window resize: Reflow;Add/remove a stylesheet: Reflow and Repaint;
Window scroll: Reflow (Affects only if a layout change ismade to the page) and Repaint;
Calling JS getComputedStyle(): Reflow;
Getting windows dimensions with JS: Reflow;
Using scroll() functions from JS: Reflow;
Getting box metrix with JS: Reflow;
Setting an element focus using “element.focus()”: Reflow;
Typing text in an input box: Reflow and Repaint;
Use style attribute: Reflow and Repaint;
Manipulating the class attribute: Reflow and Repaint (Affects only if the class change some visuals to the page);
So as we easily understand, there is a lot of action that we normally do that may be leading a user to say that their app is sluggish. And for most of these actions, I risk to say that a huge percentage of us didn’t even know they were responsible for that. As I said before, sometimes we do things simply because we know they work.Before going further and talk about techniques that we can follow to minimise these impacts, let’s just sit a little more and think about a couple of the items I listed in the table above.
Calling JS getComputedStyle(), window dimensions, scroll() or box metrics
Modern browsers are getting smarter, or at least they start trying to fix the poor code that us humans do. For instance, modern browsers can set up a queue of the changes that your scripts require and perform them in batches. This way, if we have several changes each requiring a reflow, they could be combined and only one reflow is needed. Naturally, browsers can add requests to the queue and then flush the queue once a certain amount of time passes or a certain number of changes is reached. It’s up to them to decide.
This is a very good optimization mechanism if it weren’t for the fact that we, human developers, can inadvertently block this from happening.

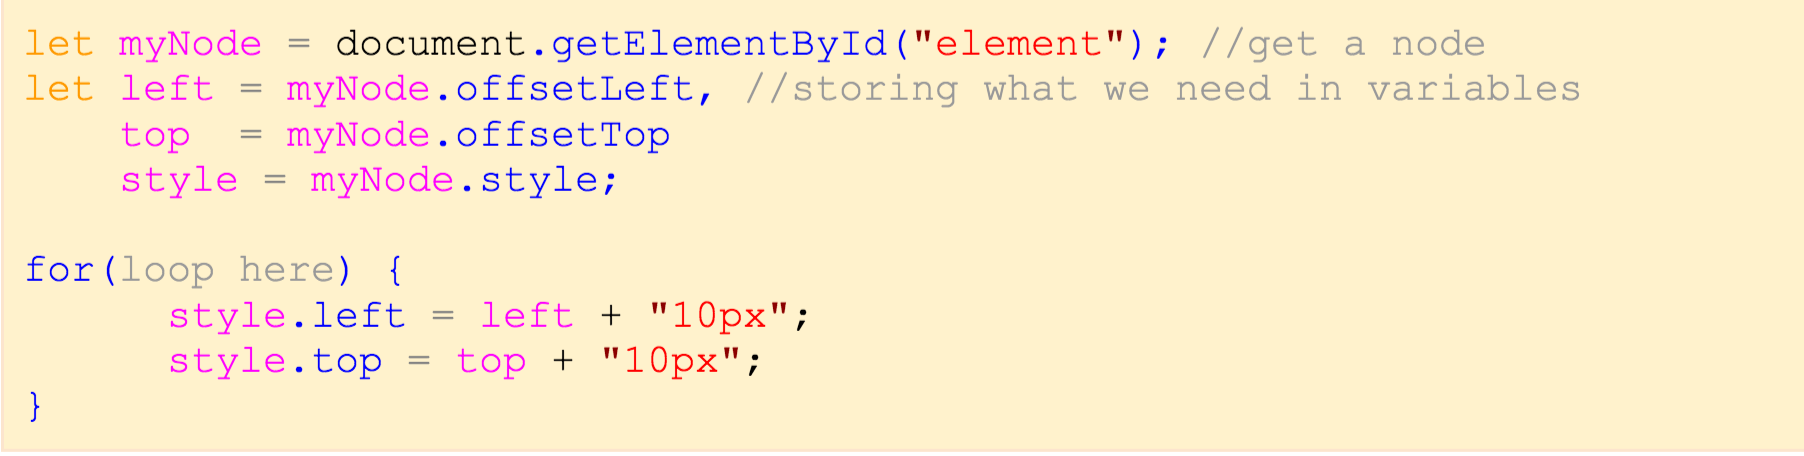
Sometimes our scripts may prevent the browser from using this queue of changes, causing it to flush that queue and perform all batched changes. Generally is something that happens when we request a style information like the ones we are talking about (getting offsets, using scroll stuff).Let’s say that we have a script that needs to change the top value of an element based on a position in the screen:

What is happening here is that the script, by requesting the “offsetTop” information from the browser, is saying “hey, please give the most updated information…NOW” and the browser, because it’s so well ordered, to give that information as updated and accurate as possible, first needs to flush the entire queue, run all tasks and then reflow/repaint the screen so finally he can send the right information back to the script.
Apparently we are only adding one reflow request but in fact, we could be triggering much more than that.
Now imagine having these types of requests happening in succession, like inside a loop… mind blows! Avoid this or at least, minimise it’s usage.
How to minimise repaints and reflows
The question in our minds may presumably be “What can we do to reduce the number of reflows and repaints?”
In the next few minutes, I will try to give you some tips on how to avoid reflows and repaints and also, when that is not possible, ways of reducing the number of changes to the page.
Reduce DOM depth
Reducing DOM depth means that, maybe you don’t need to have those 20 <div> and <span> elements all children of the same parent element. When a reflow occurs, the DOM tree nodes above and below of the node that was changed will also change (reflow) and naturally the more nodes we have in our tree, the more effort the browser will need to spend.
Have a clean CSS sheet
Since repainting means time and resource consumption for the browser, having as few properties and attributes as possible is one good way of helping the browser show stuff on screen. Remember to remove all styles from your CSS sheet that you don’t need.
Also, keep in mind to not abuse too much of CSS selectors since they cost more CPU power.
Don’t change individual CSS styles
A lot of times, we need to change a bunch of styles when a user performs an action. In this scenario, it is best if we just apply a class to the element instead of changing 3 or 4 CSS styles.
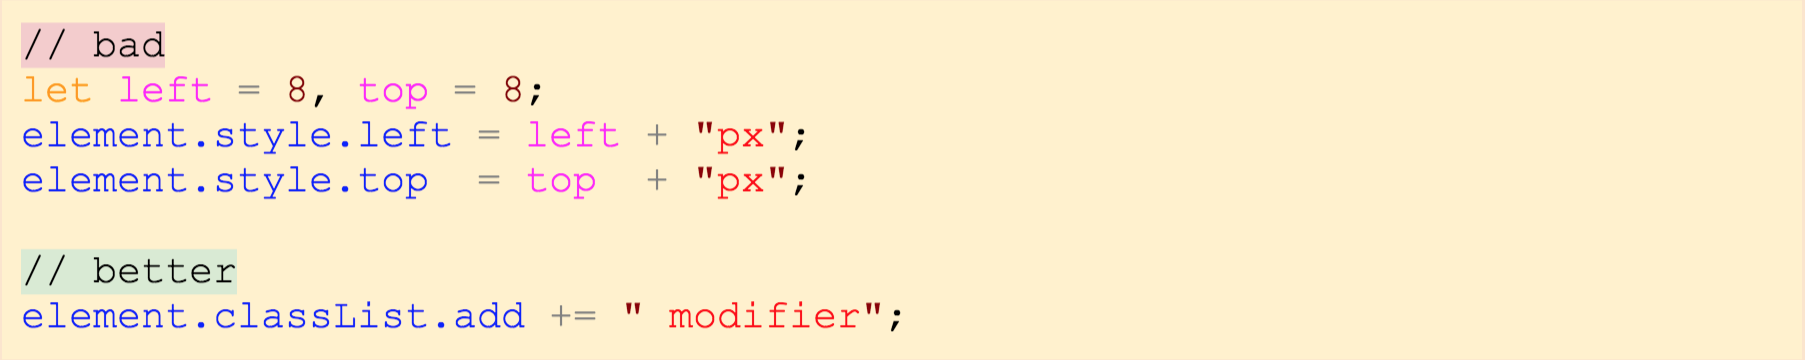
In this example, we are adding 2 reflows (bad) instead of just 1 (better).Another cool tip about this i, if we have a component that may have a lot of changes, it could be best to apply a class not to the wrapper element but instead to a more specific element where the change is going to happen. This could help the browser to manage better the amount of the RenderTree that he needs to reflow.Using Javascript “.cssText” property could be a very nice solution when we need to change something using calculated dynamic information. But don’t push too much on this.

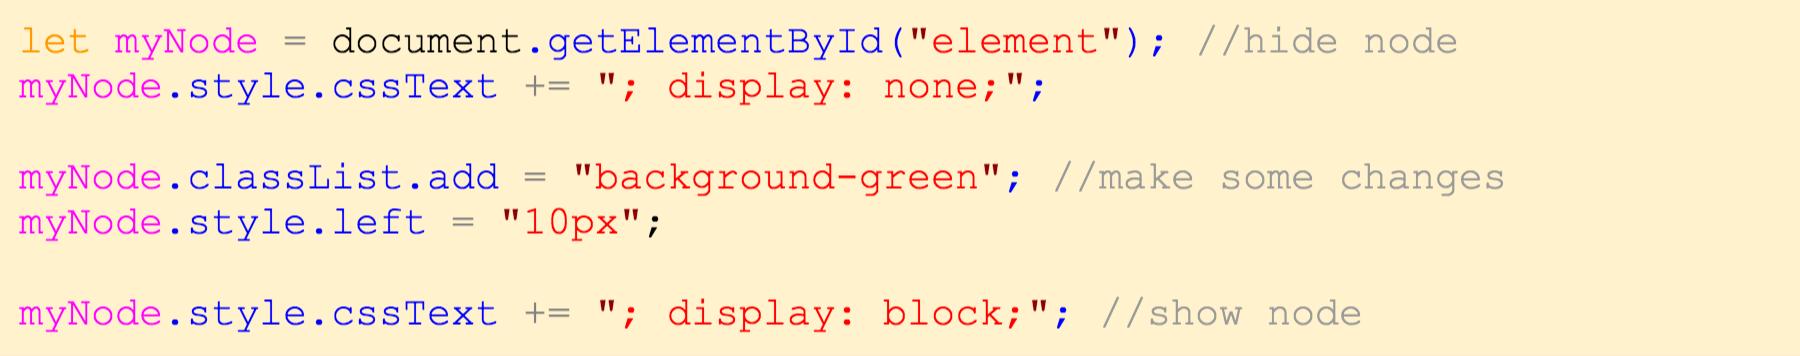
Batch DOM changes
In some scenarios we may need to change a lot of elements in our RenderTree. For this we can go with two options:
- Clone the node that you need to change, apply all the changes you need and then replace the original one. The same is valid if you are creating and appending a new node to the DOM;
 In this example, we are adding 1 reflow and 1 repaint.
-
Change the visibility of the node you need to change using “display: none;”, make your changes and then restore the display.
Avoid to much computed styles
Avoid inline styles
Use absolute/fixed positioning
Reduce the “unnecessary” smoothness
Tools to help us
Browser Dev Tools (inspector)
-
Open the inspector tools (hit F12 or left click the page and select “Inspect”);
-
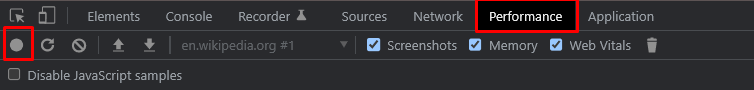
Access the TAB named “Performance”;
-
Click the first icon on (the round dot) to start record (a popover will be visible indicating that a recording is underway);
-
Refresh the page that we are inspecting;
-
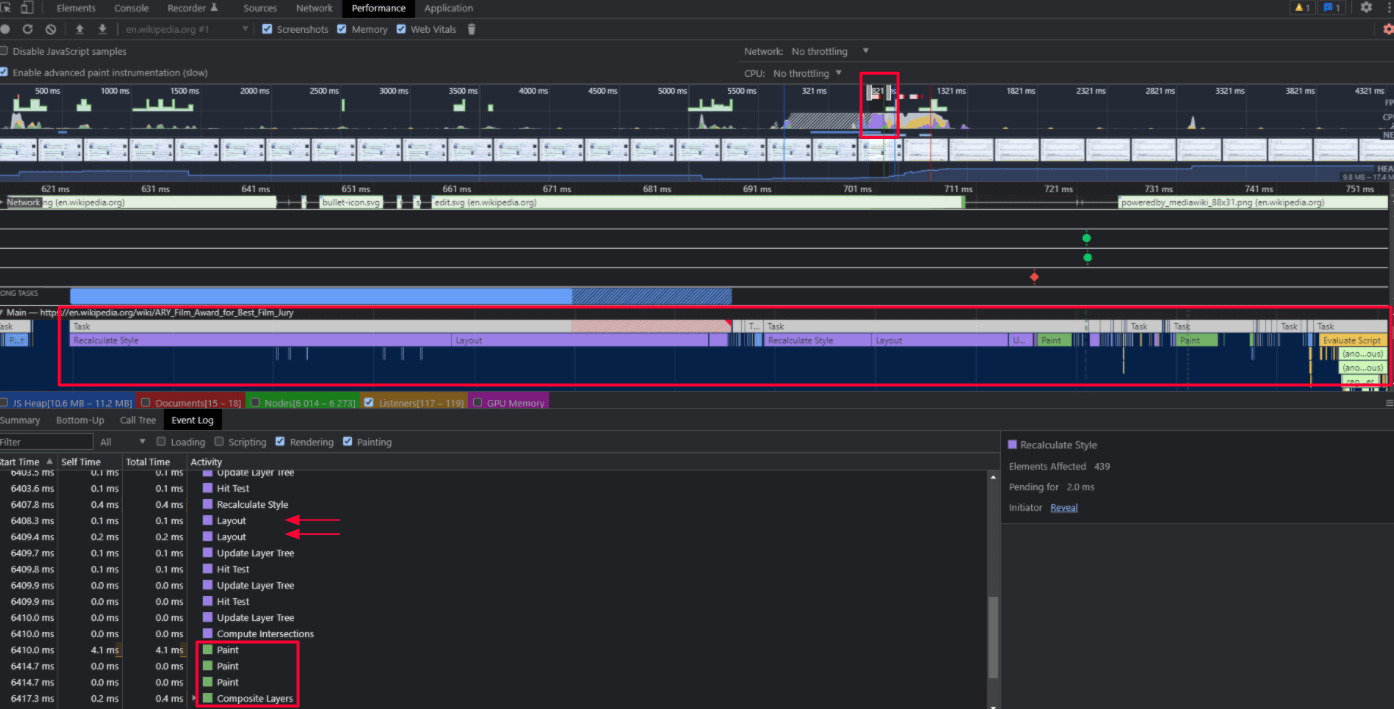
Hit “Stop” in the inspector popup to stop recording and process the data.
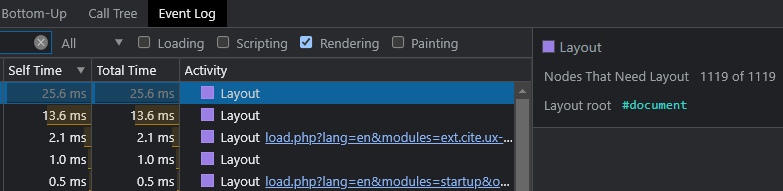
-
This layout change request took more than 25ms do finish;
-
It affected almost 1119 nodes in the DOM;
-
It affected the entire DOM tree (#document)

Other Tools
-
Lighthouse Extension (for Chrome, Firefox, Edge);
Conclusions